
tier1 – Carbon Reduction Plan
| Supplier name | Tier 1 Asset Management Ltd |
| Publication date | 12th Nov 2026 |
| Reporting year | Calendar year 2025 (1 January to 31 December 2025) |
| Baseline year | FY2022 |
| Net zero commitment | 2050 |
This page sets out the Carbon Reduction Plan report. The full document, including the supporting annexes (Annex A emissions by category, Annex B calendar year 2024 comparison method, Annex C year-on-year projection to 2050 and Annex D Scope 3 category screening), is available to download as a PDF.
Download the full Carbon Reduction Plan (PDF, 12 pages)
Commitment to achieving net zero
Tier 1 Asset Management Ltd is committed to achieving net zero emissions by 2050.
As a leading IT asset disposal (ITAD) company, Tier 1 drives the circular economy through its BSI Kitemarked remanufacturing process and environmentally conscious recycling of end-of-life IT equipment. This reduces demand for new products and the emissions that come with them, by extending the life of IT equipment and ensuring proper downstream processing.
This commitment applies to Tier 1’s UK operations, including the Manchester and Maldon sites, and the environmental measures in this plan will be in effect when performing contracts.
Baseline emissions footprint
Baseline emissions are a record of the greenhouse gases produced before the introduction of any strategies to reduce emissions. They are the reference point against which emissions reduction is measured.
| Baseline year: FY2022 | |
| Additional details relating to the baseline emissions calculations: | |
|
The FY2022 baseline covers Scope 1, Scope 2 (location-based) and selected Scope 3 categories: Category 1 Purchased goods and services, Category 3 Fuel- and energy-related activities, Category 4 Upstream transportation and distribution, Category 5 Waste generated in operations and Category 6 Business travel. It was prepared in accordance with the GHG Protocol and UK Government Carbon Reduction Plan guidance. This is a historic baseline that deviates from the Scope 3 coverage now reported. Purchased stock for remanufacture (now in Category 1), capital goods, employee commuting, upstream leased assets and end-of-life treatment of sold products were not included in FY2022, and data collection has since moved to a GHG Protocol-aligned carbon platform. The baseline has not been restated. Progress against it should be read together with the current emissions in the next section. Category 11 (use of sold products) is excluded from every year. |
|
| Baseline year emissions: | Total (tCO2e) |
| Scope 1 | 165.5 |
| Scope 2 (location-based) | 69.4 |
| Scope 3 (included sources) | 565.8 |
| Total emissions | 800.7 |
Current emissions reporting
| Reporting year: 2025 (calendar year) | |
| Emissions | TOTAL (tCO2e) |
| Scope 1 | 84.5 |
| Scope 2 (location-based) | 39.6 |
| Scope 3 (included sources) | 2,841.2 |
| Total emissions (location-based) | 2,965.3 |
| Memo: Scope 2 (market-based) | 0.0 |
| Memo: total emissions (market-based) | 2,925.7 |
Scope 3 excludes Category 11 (use of sold products). Market-based Scope 2 assumes the 100% renewable supply described under Completed carbon reduction initiatives. Detail by source is in Annex A; the supplementary calendar year 2024 comparison is in Annexes A and B.
Scope 3 included sources
The five Scope 3 categories required as a minimum by the PPN 006 technical standard are marked. Further categories are included where Tier 1 has data.
| Scope 3 category | PPN 006 minimum | CY2025 (tCO2e) |
|---|---|---|
| Category 1 Purchased goods and services | 1,754.2 | |
| Category 2 Capital goods | 77.6 | |
| Category 3 Fuel- and energy-related activities | 28.5 | |
| Category 4 Upstream transportation and distribution (includes carriage paid by Tier 1) | Yes | 776.6 |
| Category 5 Waste generated in operations | Yes | 0.6 |
| Category 6 Business travel | Yes | 13.8 |
| Category 7 Employee commuting (including homeworking) | Yes | 55.9 |
| Category 8 Upstream leased assets | 130.8 | |
| Category 9 Downstream transportation and distribution (outbound carriage paid by Tier 1) | Yes | (621.0) within Category 4 |
| Category 12 End-of-life treatment of sold products | 3.1 | |
| Scope 3 total (included sources) | 2,841.2 |
Outbound delivery carriage is paid for by Tier 1, so the GHG Protocol places it in Category 4. It is shown for Category 9 as a memo and is not added to the total again.
Basis of preparation
-
Boundary. Operational control. The footprint covers Tier 1’s UK operations, including the Manchester and Maldon sites.
-
Reporting period. One calendar year, 1 January to 31 December 2025, used throughout this plan. Calendar year 2024 appears only in the supplementary annexes.
-
Standards. GHG Protocol Corporate Standard and Scope 3 Standard, covering the seven Kyoto Protocol gases, with UK Government greenhouse gas conversion factors for company reporting. Scope 1 and 2 are reported in line with SECR requirements where required.
-
Data. The Greenly carbon platform (spend-based and activity-based), cross-checked against Tier 1’s internal activity-based workbook. The footprint has not been independently verified.
-
Scope 2. Reported on both a location-based and a market-based basis. Electricity at both sites is supplied from 100% renewable sources, confirmed by the supplier through bills.
-
Scope 3 coverage. All five PPN 006 minimum categories are reported, with Category 9 carriage included in Category 4 as above. Categories 1, 2, 3, 8 and 12 are also included. Category 11 is excluded. Categories 10 and 13 to 15 have no identified activity (Annex D).
-
Comparison with the baseline. The increase in Scope 3 against the FY2022 baseline reflects wider reporting coverage, in particular purchased stock for remanufacture now reported under Category 1. It is not a like-for-like comparison.
Emissions reduction targets
Our targets are shown below.
Net zero by 2050, across Scope 1, 2 and the Scope 3 categories reported in this plan, in line with the UK Government requirement and Tier 1’s science-based target ambition. We define net zero as a cut of at least 90% in gross emissions, with any residual neutralised by permanent carbon removals.
Progress against the previous targets
| Previous target | Status | Comment |
|---|---|---|
| 2025: 10% reduction in Scope 1 and 2 from baseline | Achieved: Scope 1 and 2 (location-based) fell 47.2%, from 234.9 to 124.1 tCO2e | Both years on a Scope 1 and 2 boundary; methods have changed since FY2022 (see baseline details). |
| 2030: 50% reduction across all scopes | Under review | The reported Scope 3 boundary is much wider than the FY2022 baseline, so the percentage cannot be assessed. Replaced by the proposed pathway below. |
| 2035: 75% reduction across all scopes | Under review | As above. |
| 2040: net zero | Under review | Net zero by 2050 is confirmed and aligned to Tier 1’s SBTi goal; the year-on-year route is set out below. |
In order to continue our progress to achieving net zero, we have adopted the carbon reduction targets below. We project that carbon emissions will decrease over the next five years to 1,908.8 tCO2e by 2030. This is a reduction of 35.6% against 2025.
Reduction pathway to 2030 and 2050
We propose to cut gross emissions by 35.6% by 2030, to 1,909 tCO2e, and by 90.2% by 2050, to a residual of 290 tCO2e. The residual is then neutralised with permanent removals, so that net emissions are zero in 2050. Scope 1 and 2 fall fastest: 50% by 2030 and 90% by 2040. Annex C gives the year-on-year figures.
| tCO2e (location-based) | CY2025 | 2030 | 2035 | 2040 | 2045 | 2050 |
|---|---|---|---|---|---|---|
| Scope 1 and 2 | 124.1 | 62.0 | 31.0 | 12.4 | 8.7 | 6.2 |
| Scope 3 (included sources) | 2,841.2 | 1,846.8 | 1,278.5 | 852.4 | 568.2 | 284.1 |
| Gross emissions | 2,965.3 | 1,908.8 | 1,309.6 | 864.8 | 576.9 | 290.3 |
| Change on CY2025 | – | −35.6% | −55.8% | −70.8% | −80.5% | −90.2% |
| Removals to neutralise residual | – | – | – | – | – | 290.3 |
| Net emissions | 2,965.3 | 1,908.8 | 1,309.6 | 864.8 | 576.9 | 0.0 |
Gross emissions are Scope 1, Scope 2 (location-based) and the Scope 3 categories in this plan, excluding Category 11. Scope 1 and 2 are 95% lower by 2050 and Scope 3 is 90% lower. The residual is 9.8% of CY2025 emissions, within the 10% ceiling in the SBTi Corporate Net-Zero Standard. Only 2050 removals are netted off; offsets bought earlier do not count towards the reduction targets.
How the 2030 target compares with the minimum
| 2030, tCO2e (location-based) | Minimum rate | Minimum 2030 | Proposed | Proposed 2030 |
|---|---|---|---|---|
| Scope 1 and 2 | 4.2% a year (−21.0%) | 98.0 | −50.0% | 62.0 |
| Scope 3 (included sources) | 2.5% a year (−12.5%) | 2,486.1 | −35.0% | 1,846.8 |
| Total gross emissions | – | 2,584.1 | −35.6% | 1,908.8 |
Minimum rates are the linear annual reductions in the SBTi criteria, applied to CY2025. Against the FY2022 baseline, Scope 1 and 2 would be 73.6% lower in 2030 (62.0 against 234.9 tCO2e). Total emissions stay above the baseline total because the reporting boundary is wider.
How we expect to deliver it
| Source | Proposed measures | CY2025 emissions |
|---|---|---|
| Scope 1 gas | Assess heat pumps and electrification of heating at Manchester and Maldon; improve controls and insulation. | 64.0 tCO2e |
| Scope 1 vehicles and refrigerants | Move company vehicles to electric as they are replaced; leak checks and lower-warming refrigerants. | 11.4 and 9.0 tCO2e |
| Scope 2 electricity | Efficiency and on-site generation. Location-based figures also fall as the grid decarbonises. Market-based is zero with renewable supply. | 39.6 tCO2e |
| Cat 1 Purchased goods and services | Replace spend-based factors with supplier and product data; engage suppliers on their own targets; favour reuse and remanufacture. | 1,754.2 tCO2e |
| Cat 4 Transport and distribution | Consolidate routes and loads; choose lower-emission vehicles and carriers; review collection frequency. | 776.6 tCO2e |
| Cat 7 Commuting and Cat 8 leased assets | Hybrid-working and travel policy; electrify hired plant and forklifts; work with landlords on energy supply. | 55.9 and 130.8 tCO2e |
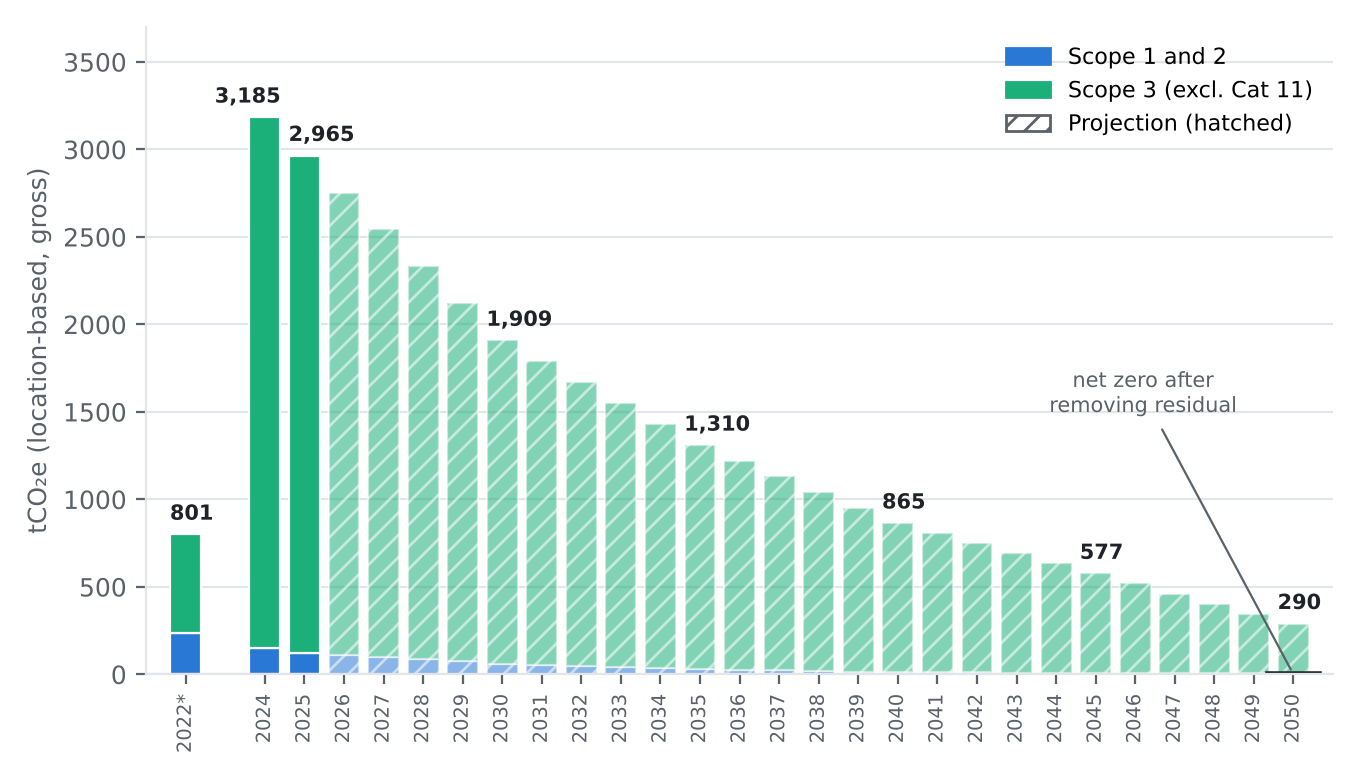
Figure 1. Gross emissions (location-based), by year, with the proposed pathway to 2050 (hatched). *The FY2022 baseline covers a narrower Scope 3 boundary than CY2024 and CY2025.
Carbon reduction projects
Completed carbon reduction initiatives
The following environmental management measures and projects have been completed or implemented since the FY2022 baseline. Scope 1 and 2 emissions are now 110.8 tCO2e, a 47.2% reduction, against the FY2022 baseline, and the measures will be in effect when performing the contract. The reduction is the observed change in Scope 1 and 2 and is not attributed to individual measures. Scope 3 is not comparable with the baseline.
-
100% renewable electricity. Electricity at the Manchester and Maldon sites is supplied from renewable sources, confirmed by the supplier (certificates available upon request) . Market-based Scope 2 emissions are zero; location-based Scope 2 was 39.6 tCO2e in CY2025.
-
Circular economy services. BSI Kitemarked remanufacturing, reuse and responsible recycling of IT equipment reduce demand for new products. Avoided emissions are not netted off the reported footprint.
-
Environmental management system. Tier 1 holds ISO 14001 certification from ISOQAR (Cert N:15482) and holds an EcoVadis sustainability rating of Silver.
-
GHG Protocol-aligned carbon accounting. Reporting moved to the Greenly platform for CY2025, bringing purchased stock, capital goods, leased assets and logistics into measured scope.
Future carbon reduction initiatives
In the future we hope to implement further measures such as:
-
Better Scope 3 data. Replace spend-based factors for purchased stock (Category 1, the largest source) with supplier- or product-specific data, and reconcile company-vehicle fuel to mileage.
-
Logistics. Investigate route and load consolidation, carrier selection and lower-emission vehicles for collections and deliveries (Category 4, about a quarter of the footprint).
-
Avoided emissions. Quantify and report avoided emissions from circular economy practices separately from the footprint.
-
Wider scope. Review remaining Scope 3 categories, including Category 11, and extend reporting where data allows.
-
Residual emissions. Identify emissions that cannot be eliminated and offset them using high-quality, UK Government-approved carbon offsets such as those certified under the Woodland Carbon Code.
-
Assurance and reporting. Verify any net zero claim through an ISO 14064 accredited third party, and align reporting to GRI, TCFD, ISSB and the SBTi. Progress is reviewed internally and reported annually, and this plan will be updated at least annually, as PPN 006 requires.
Standards and framework alignment
Tier 1 aligns itself to the following and looks to make sure that tools used in support of this plan demonstrate similar commitment:
-
GHG Protocol (Scopes 1, 2 and 3)
-
UK Government Carbon Reduction Plan template (PPN 006)
-
ISO 14001 Environmental Management System
-
PAS 2060 Carbon Neutrality Standard
Declaration and sign off
This Carbon Reduction Plan has been completed in accordance with PPN 006 and associated guidance and reporting standard for Carbon Reduction Plans.
Emissions have been reported and recorded in accordance with the published reporting standard for Carbon Reduction Plans and the GHG Reporting Protocol corporate standard¹ and uses the appropriate government emission conversion factors for greenhouse gas company reporting.²
Scope 1 and Scope 2 emissions have been reported in accordance with SECR requirements (where required), and the required subset of Scope 3 emissions have been reported in accordance with the published reporting standard for Carbon Reduction Plans and the Corporate Value Chain (Scope 3) Standard.³
¹ https://ghgprotocol.org/corporate-standard
² www.gov.uk/government/collections/government-conversion-factors-for-company-reporting
³ https://ghgprotocol.org/standards/scope-3-standard
Download the full document
The annexes referred to in this plan (Annexes A to D) are included in the full PDF.
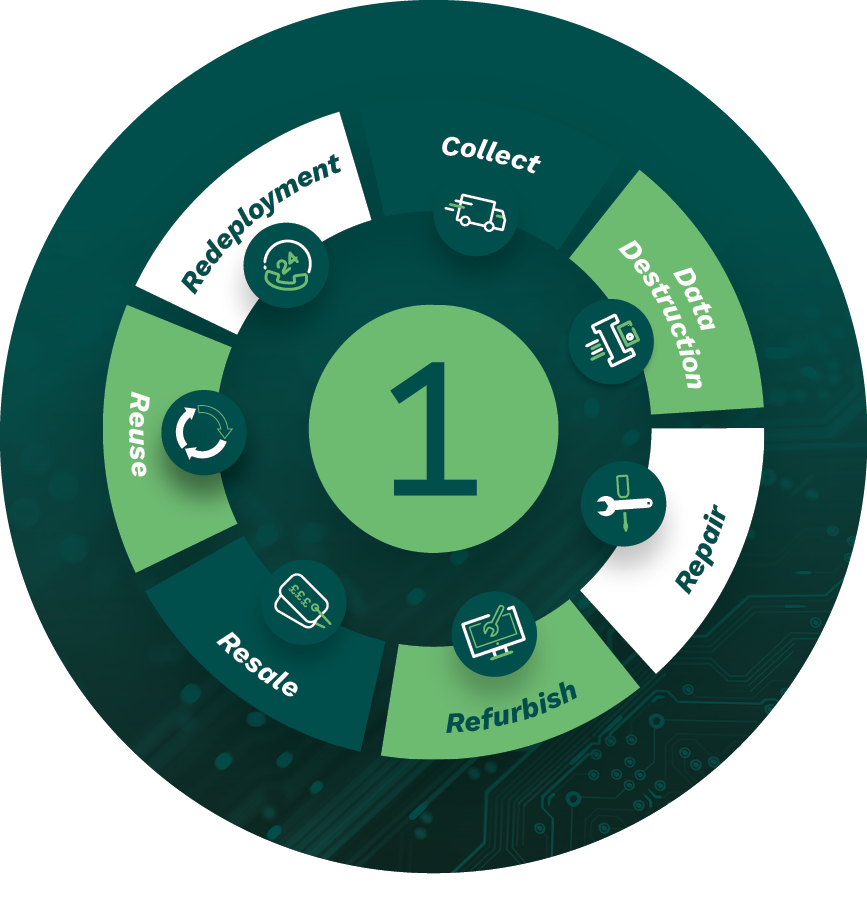
Reduce. Reuse. Redeploy. Recycle
Circular Approach to Sustainability
We ensure that the Lifecycle Services we provide are sustainable and circular in approach, and actively promote the reuse of all equipment where possible. We work closely with our clients to improve awareness of environmentally favourable solutions, ensuring recycling is the last option considered and making a real contribution to your ESG goals.